
C# is a beautiful language with many features like methods, classes, loops and many more. That’s why it is considered a high-level language. To execute C# code, it is lowered to CIL by compiling and from there to Assembly code while running. In this article, I will show you why it is built this way and how to view the lowered code.
Why so complicated?
Programming applications without constructs like while, for and async is unthinkable
these days. But what makes a programmer’s life easier doesn’t necessarily make things easier for a computer. CPUs still
work with simpler structures and a special instruction set. Assembly language is used to control CPUs, and its instructions
are tied to specific functions of the CPUs.
Assembly language is not a standardized language. Each CPU architecture like x86, x64 or ARM has their own instructions and different CPUs usually have additional instruction sets to improve certain operations. The translation from C# and other .net languages like Visual Basic and F# to Assembly language takes time and debugging would be difficult. That is why an intermediate language is used with the unexciting name Common Intermediate Language or short CIL (originally called MSIL where MS stands for Microsoft). CIL is similar to Assembly but more advanced and standardized.
Roslyn is used to compile C# and VB code to CIL.
The result is a binary file, usually a .dll or .exe file, which can be deployed to the target
machines. To execute these files, a .net runtime is used which reads the CIL and translates it on the run to Assembly code.
The runtime is either installed on the target system or deployed with the application. There are different runtimes for each
architecture and operating system. A benefit of a runtime is the ability to generate optimized Assembly code for every CIL
code that is called. This is called just-in-time compilation (JIT).
.net uses tiered compilation. When the application starts and a method needs compilation, it is compiled quickly and with minimal optimization. For methods that are called frequently (“hot” methods), optimized Assembly code is generated. Since .net 8 dynamic PGO (profile guided optimization) is enabled by default. This allows even better optimization with instrumentation data that is collected for hot methods first.
The opposite of just-in-time compilation is ahead-of-Time (AOT) compilation where a .net application is compiled to native code directly. This reduces the size of the deployment, the memory usage and can improve the performance because nothing has to be compiled at runtime. Although, the downside is the lack of optimization for the current CPU and the compilation time while deploying along with other challenges. This article won’t cover the decompilation of AOT binaries.
Starting with a sample application
We use a simple application to work with. The application is just one static C# class compiled with .net 10:
using System;

namespace CSharpToAssemblyTest
{
    public static class Program
    {
        public static void Main()
        {
            int sum = SumInts(1, 2, 3);

            Console.WriteLine(sum);
        }

        private static int SumInts(int num1, int num2, int num3)
        {
            int result = num1 + num2 + num3;

            return result;
        }
    }
}
This is evidently not a very sophisticated application, it just prints the number 6 with a few detours, but it has potential for optimizations.
We can build the application, once with the debug configuration and once with the release
configuration. As a result, we get a few files and will use the .dll. The .exe is just a
wrapper to call the code in the .dlls.
Viewing IL From .net Binaries
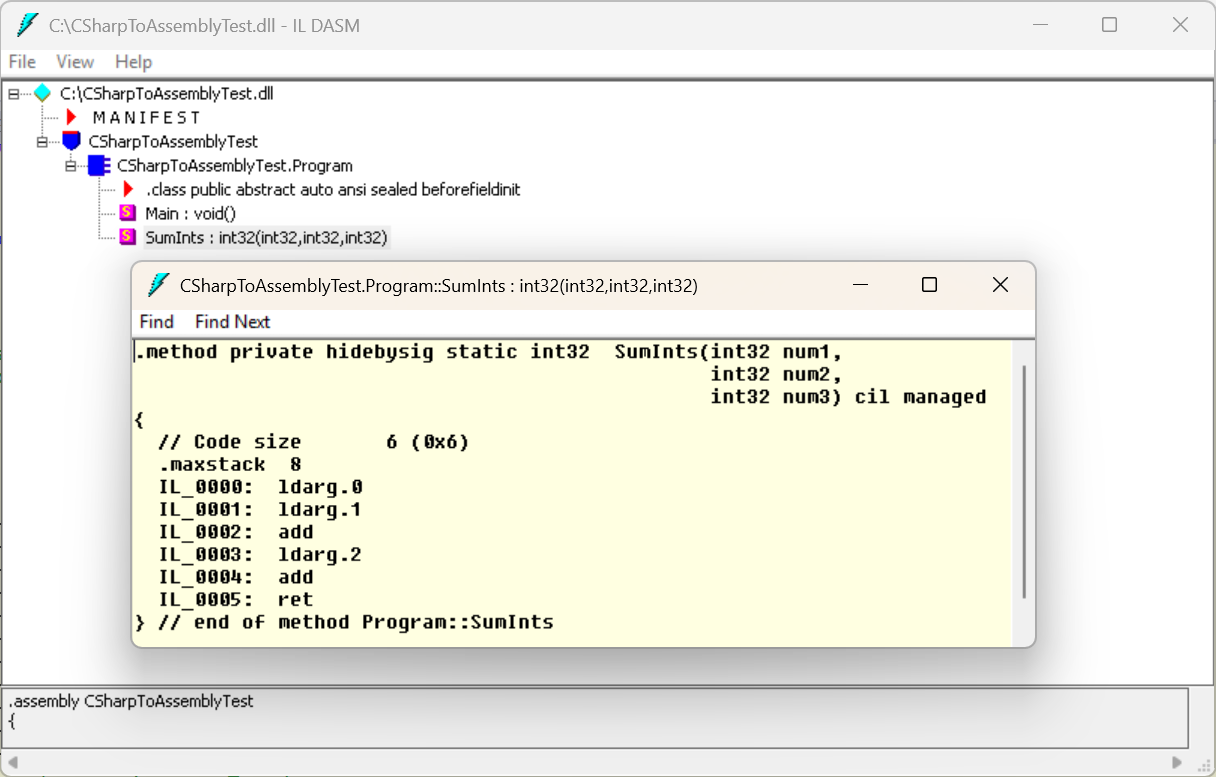
Unfortunately, Visual Studio does not have a built-in tool for viewing IL. But there is a tool called
ildasm.exe
which is installed with the .net SDK. The tool is very rudimental but still useful. When a .dll is loaded, it shows
all classes and methods that can be clicked to show the IL:
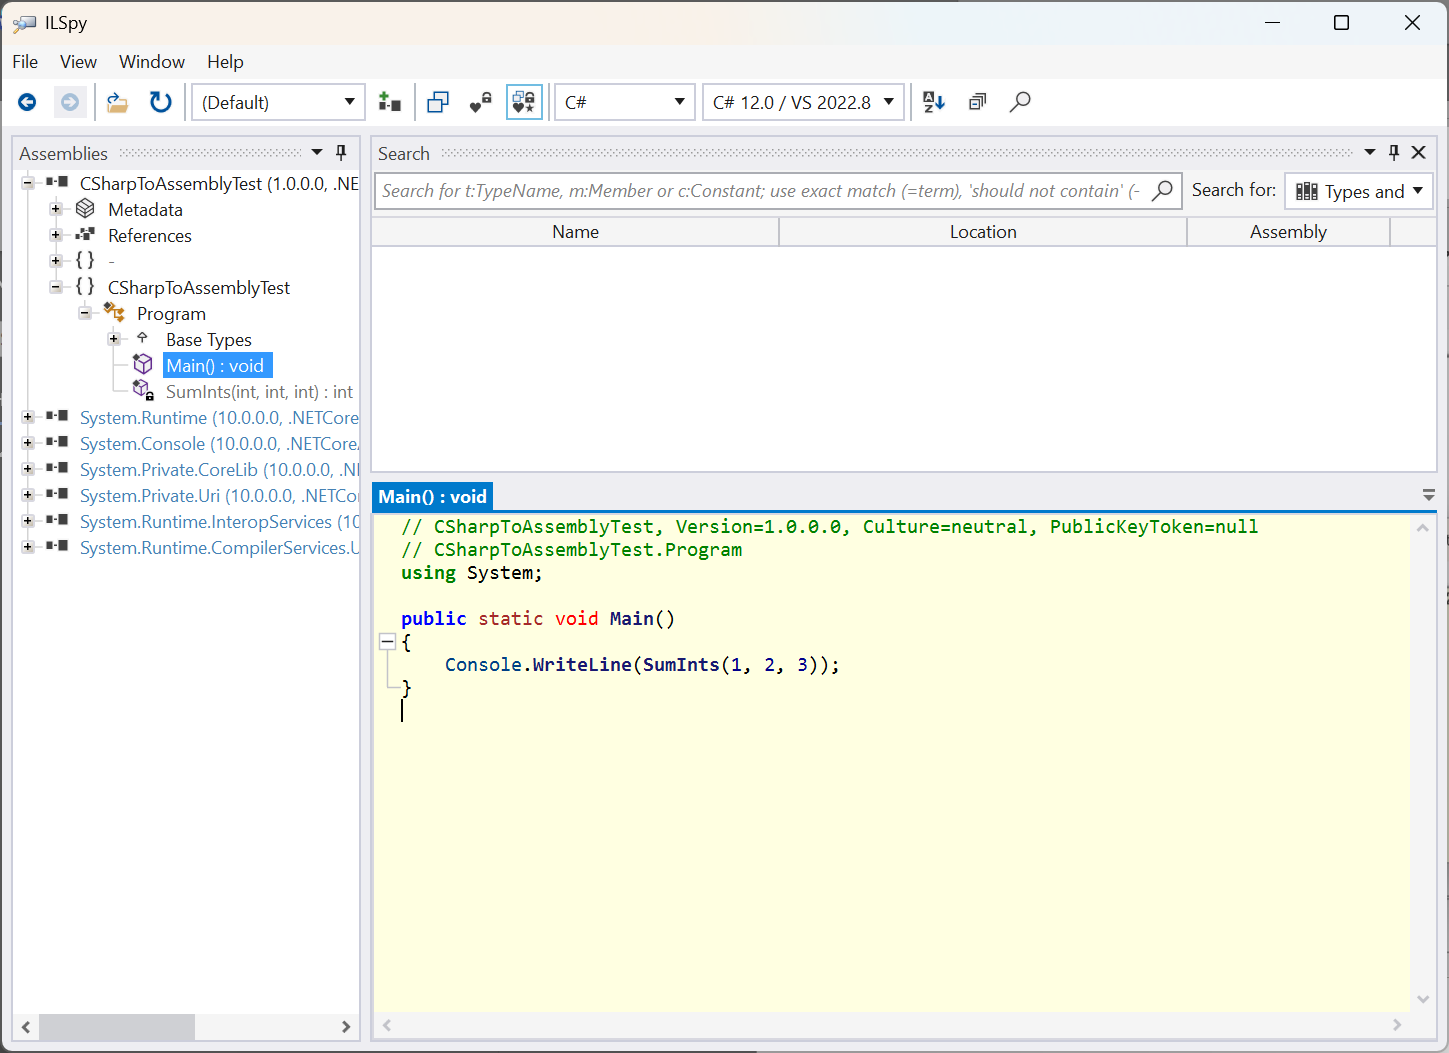
A more advanced tool is ILSpy. It has
syntax highlighting, shows tooltips for the IL instructions and is able to map the IL back to C#. This is a translation
form IL to C# without using the .pdb file. With C# code it is easier to see how structures like async
and lambda functions are implemented after the compilation. Comments, additional new lines and temporary variables are not in the IL
and won’t therefore be in the C# code.
For small tests, there are online tools available. SharpLab is a well-known tool, but unfortunately it seems to no longer be maintained. An alternative is .NET Lab which is maintained and has additional features.
Analyzing the CIL code
By viewing the IL code, we can compare the debug and release builds, for example. In ILSpy,
I opened both .dlls and arranged the IL for the SumInts methods side-by-side:
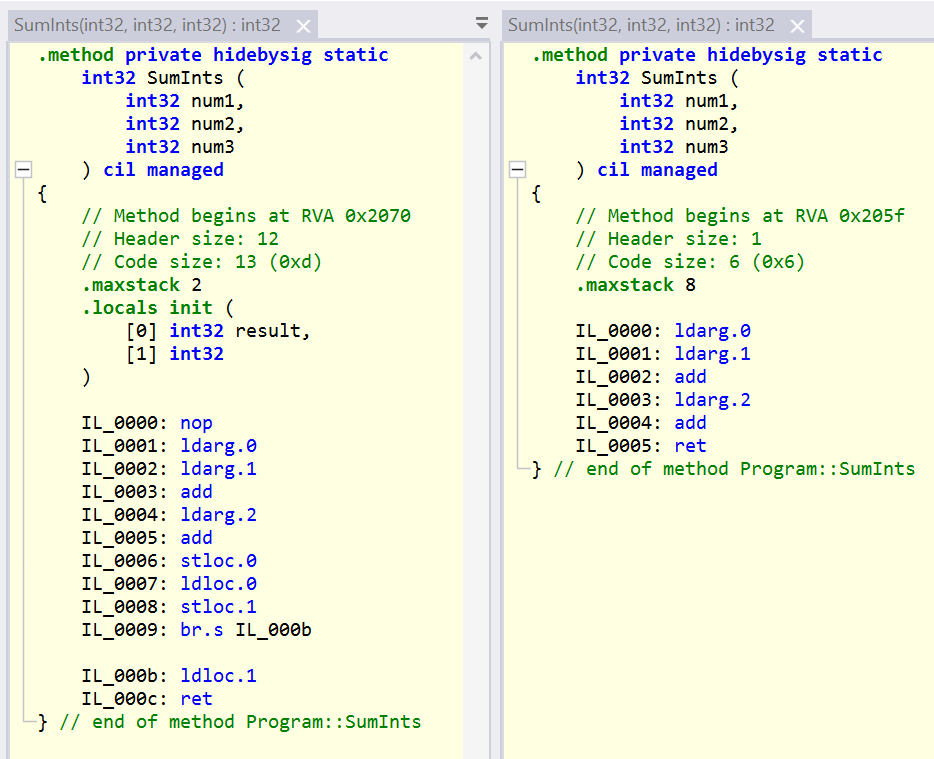
The IL for methods is structured like the original function with a name and parameters. The code for the release
build on the right side is much shorter and easier to understand. It begins by loading the first argument to the stack
(ldarg.0), then the second argument (ldarg.1) and then adding both values (add) which
reduces the stack by one and leaves the result on the stack. It continues by loading the third argument (ldarg.2)
and adding it to the previous result on the stack (add). The result is the sum of the three arguments on the top
of the stack which is returned with ret.
The IL for the debug build on the left side leads to the same result but has more instructions. These additional
instructions are used for debugging. A breakpoint on the return clause in the C# code of the SumInts method
would never be reached while debugging a release build. Also, breakpoints on curly braces and other places are
not reachable. To allow breakpoints, a debug build has additional instructions, like nop which is an operation without
any effect.
Viewing Assembly code
Visual Studio offers a built-in tool to view Assembly code. To use the tool, you need to set a breakpoint in the code, start the application and then open the tool under Debug – Windows – Disassembly.
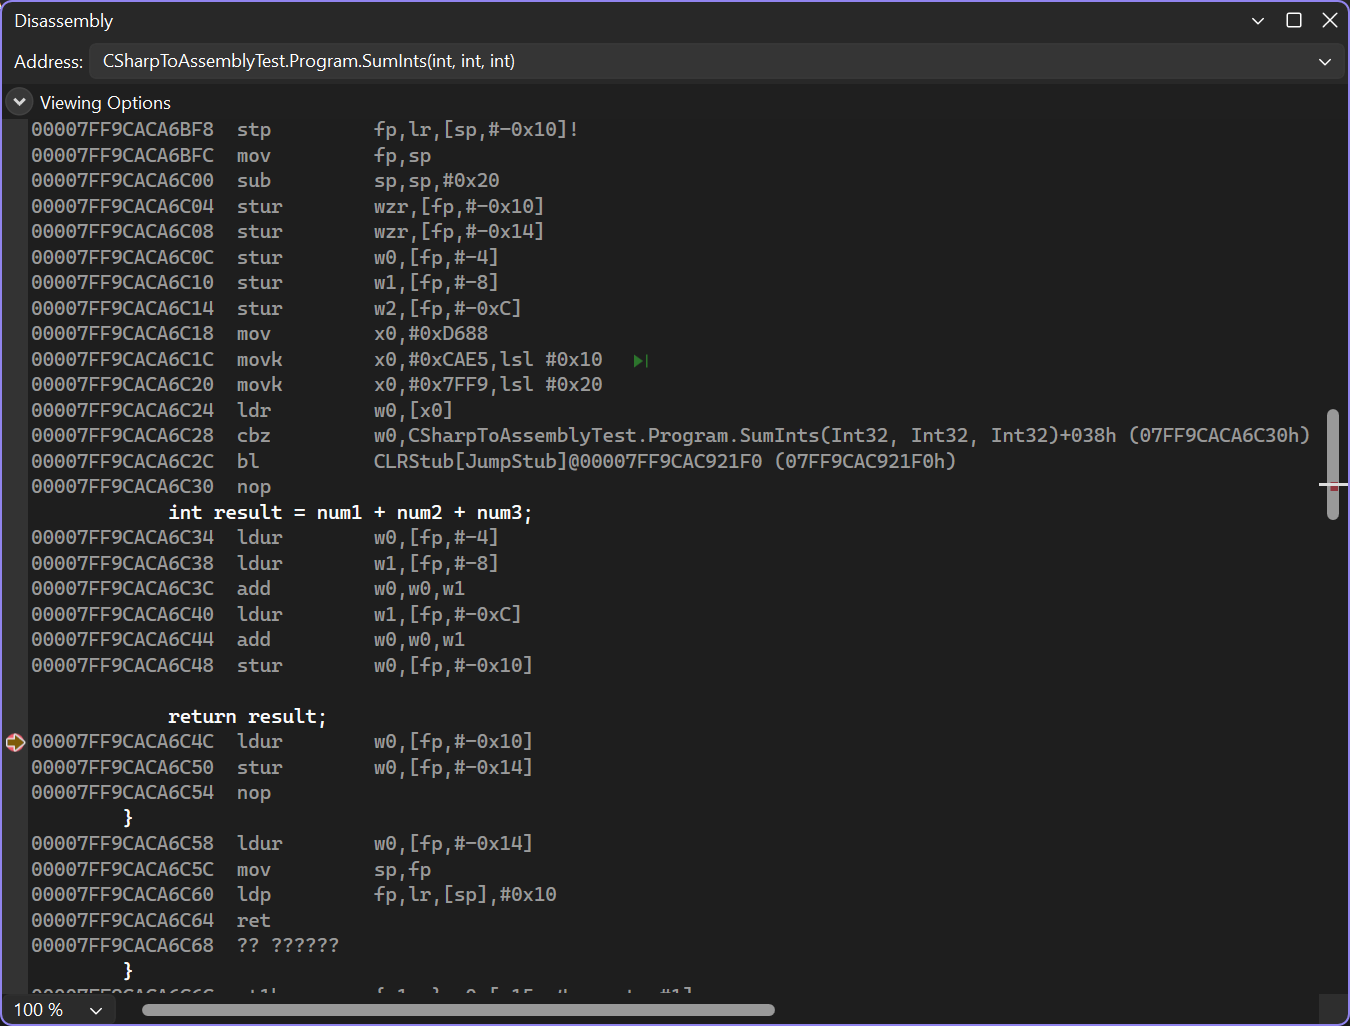
This view is not very clear and not configurable, but the runtime offers additional ways to view Assembly code. By setting
the environment variable DOTNET_JitDisasm, we can filter for specific method names.
To view Assembly code, we open a console and navigate to the project folder with cd. We need to run the
release build of the application to get optimized Assembly code:
dotnet run -c release
With the sample application from above, this prints the number 6. To set an environment variable in the Windows console we
can use the set command (set name=value), in Powershell that would be the $env:
command ($env:name=value). We configure DOTNET_JitDisasm to print Assembly code for the methods
Main and SumInts with the following command in the Windows console:
set DOTNET_JitDisasm=Main SumInts
This will print all Assembly code for methods with these names. Since dotnet run runs .net code itself, this
could also print Assembly code for methods that are not in our code. Instead of just configuring method names, we can also
filter for assemblies, classes and even substrings of method names. A
complete documentation
can be found in the in the runtime repository. The following command would print Assembly code for all methods in the
Program class of our Assembly.
set DOTNET_JitDisasm=CSharpToAssemblyTest!CSharpToAssemblyTest.Program:*
The commands to filter for the SumInts method and running the release build of the application are
as follows:
set DOTNET_JitDisasm=CSharpToAssemblyTest!CSharpToAssemblyTest.Program:SumInts
dotnet run -c Release
This leads to this result on an ARM64 machine:
; Assembly listing for method CSharpToAssemblyTest.Program:SumInts(int,int,int):int (Tier0)
; Emitting BLENDED_CODE for generic ARM64 on Windows
; Tier0 code
; fp based frame
; partially interruptible
; compiling with minopt

G_M000_IG01:                ;; offset=0x0000
            stp     fp, lr, [sp, #-0x20]!
            mov     fp, sp
            str     w0, [fp, #0x1C]
            str     w1, [fp, #0x18]
            str     w2, [fp, #0x14]

G_M000_IG02:                ;; offset=0x0014
            ldr     w0, [fp, #0x1C]
            ldr     w1, [fp, #0x18]
            add     w0, w0, w1
            ldr     w1, [fp, #0x14]
            add     w0, w0, w1

G_M000_IG03:                ;; offset=0x0028
            ldp     fp, lr, [sp], #0x20
            ret     lr

; Total bytes of code 48

6
We can see the meta data of the method, the Assembly code and 6 as the result of the application. The meta data
tells us that it is for Tier0 and not optimized (compiling with minopt). The lack of optimization
allows fast compilation to Assembly code which leads to a fast startup. To get optimized code from the beginning, we can
disable tiered compilation by setting DOTNET_TieredCompilation to 0 and running the application
again. We print the Assembly code for Main and SumInts this time:
set DOTNET_JitDisasm=Main SumInts
set DOTNET_TieredCompilation=0
dotnet run -c Release
The results are as follows:
; Assembly listing for method CSharpToAssemblyTest.Program:Main() (FullOpts)
; Emitting BLENDED_CODE for generic ARM64 on Windows
; FullOpts code
; optimized code
; fp based frame
; partially interruptible
; No PGO data
; 0 inlinees with PGO data; 1 single block inlinees; 0 inlinees without PGO data

G_M000_IG01:                ;; offset=0x0000
            stp     fp, lr, [sp, #-0x10]!
            mov     fp, sp

G_M000_IG02:                ;; offset=0x0008
            mov     w0, #6
            movz    x1, #0x7E70
            movk    x1, #0xDDF2 LSL #16
            movk    x1, #0x7FFA LSL #32
            ldr     x1, [x1]
            blr     x1

G_M000_IG03:                ;; offset=0x0020
            ldp     fp, lr, [sp], #0x10
            ret     lr

; Total bytes of code 40

6
We only see the code for Main and it prints the constant value 6 (mov w0, #6). The
runtime was able to recognize that the code only adds three constant numbers and calculated the result itself.
The SumInts method is not used anymore, it was short, without complicated structures and therefore eligible for
inlining (the actual conditions for inlining are dynamic). This inlining allowed new optimizations that result in the
constant value in the end.
To see optimized Assembly code for the SumInts method, we need to disable inlining with the MethodImpl attribute
back in the C# code:
[MethodImpl(MethodImplOptions.NoInlining)]
private static int SumInts(int num1, int num2, int num3)
{
    int result = num1 + num2 + num3;

    return result;
}
In more complex and long-running scenarios, we can also observe the work of dynamic PGO which generates code to collect data and finally emits optimized code. Tiered compilation must be enabled for this.
Conclusion
Viewing lowered code after the compilation of a .net application is interesting, but for most developers it is not very useful. IL and Assembly code can be used to analyze performance problems, for example. Still, it is nice to see that .net provides the ability to view everything we could need at some time.